
Watch and learn
Excel 2010 (and 2007) no longer have the chart wizard to help you set up a chart. Here is a tutorial on how to get started with charts in Excel 2010 (and 2007).
If you do not see the video, please click on the link to view it (you will leave this page):
Top tips for help with math
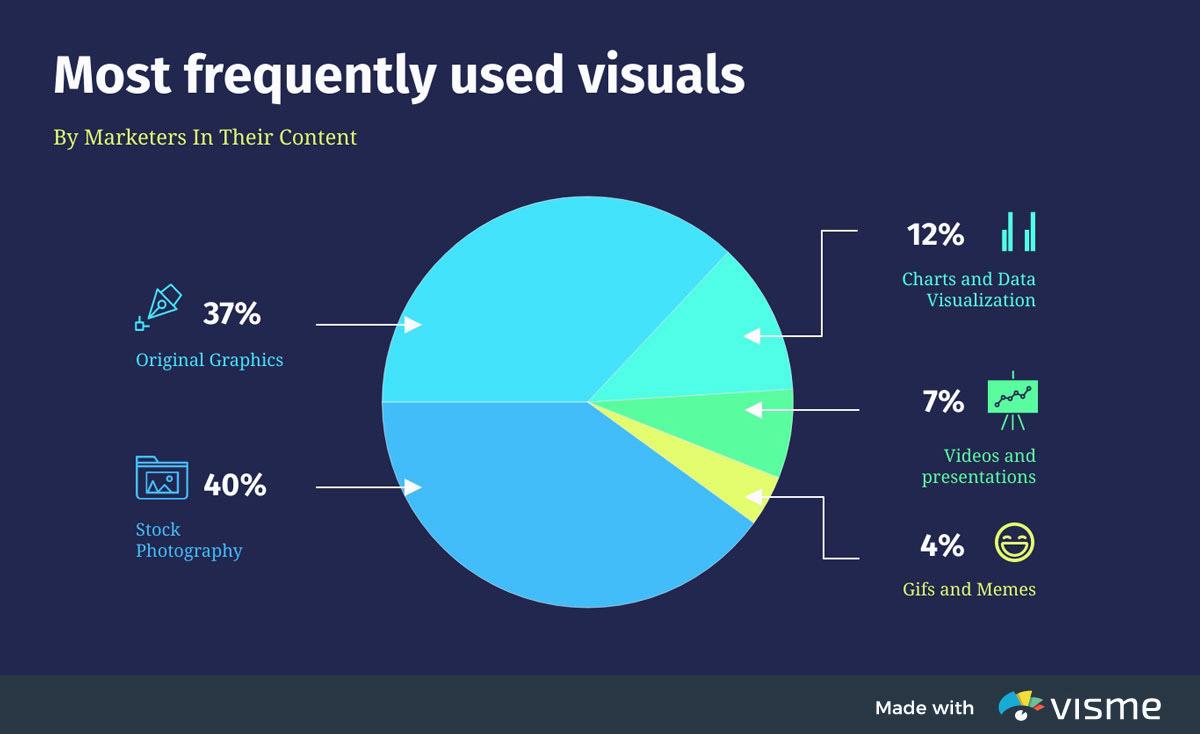
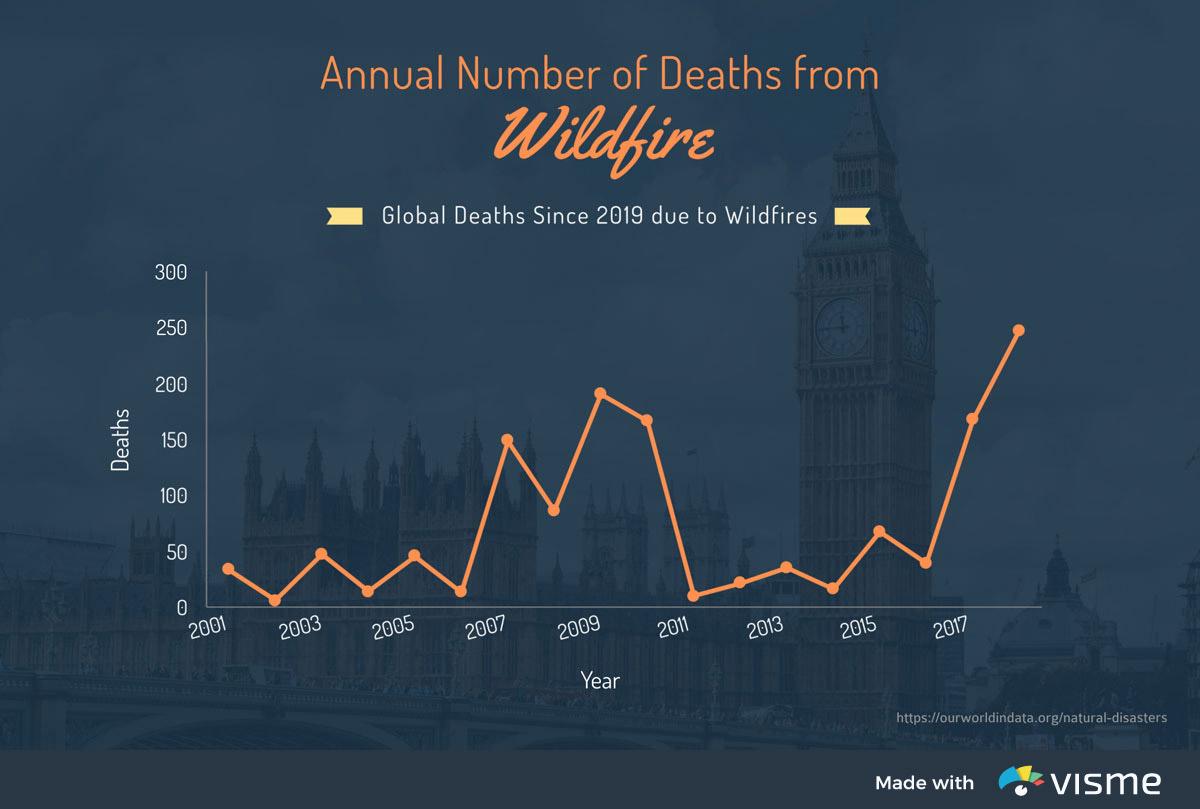
A chart is a graphical representation of information and/or data Charts and graphs allow one to visually represent data in order to make information more digestible and visually appealing to a viewer. A chart can represent tabular numeric data, functions or some kind of qualitative structure in a visual manner.
Enhance your learning
In this TED Talk, David McCandless turns complex data sets, like worldwide military spending, media buzz, and Facebook status updates, into beautiful, simple diagrams that tease out unseen patterns and connections. Good design, he suggests, is the best way to navigate information glut -- and it may just change the way we see the world.
If you do not see the video, please click on the link to view it (you will leave this page):
Value for me?
Graphs and charts are used to make information easier to visualize. Humans are great at seeing patterns, but they struggle with raw numbers. Graphs and charts can show trends and cycles.
Visualize Topic
Enhance your wellness
Did you know VIU has an amazing collection of events, activities and resources to help you thrive! There is something for everyone. Browse the opportunities on the Thrive website.
See a full collection of Health and wellness resources on VIU's website.